I came across these graphs relating to the 1932, 1962, 1987 and the current crash. Looks familiar, than get ready for a sharp downturn still to come.
![]()
I came across these graphs relating to the 1932, 1962, 1987 and the current crash. Looks familiar, than get ready for a sharp downturn still to come.
![]()
Re: 4 previous crashes
Ehsan, can you pls post a larger version of this image, or guide to the source? I can't even read whats on the charts. Thanks.
I am interested to know what scale are they measuring on the Y-axis. Is it apples to apples?
Re: 4 previous crashes
Found the link:
http://seekingalpha.com/article/61266-4-prior-market-crashes#comment_header
Re: 4 previous crashes
Unfortunately I still can’t really make out whats on the Y-axis. I expanded the pic as much as I could, and I see that all the charts have different scale on the Y-axis. 1932 is in decimals and below 8.50 - not sure what its measuring. 1962 is on a scale between 51 and 73 - again not sure what is it. 1987 and 2008 probably show S&P 500 (though I can’t tie S&P numbers). May be all of them show S&P??
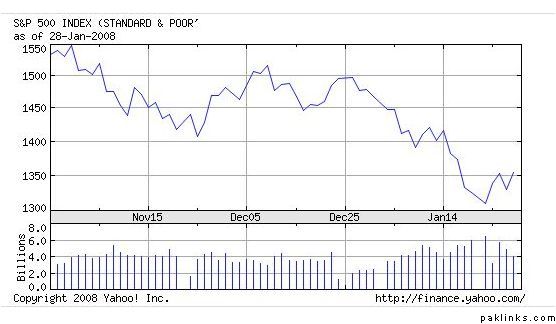
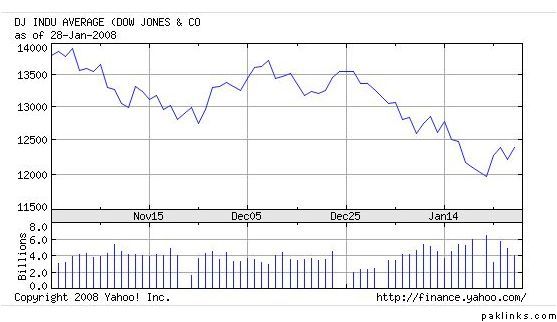
Here are the Dow and S&P Charts for the last 3 months.
Dow:
S&P: